MohrPlotter 3
MohrPlotter is a simple program to plot Mohr Circles for stress and do simple calculations related to them. It was written to help structural geology professors and students quickly and accurately construct Mohr diagrams so that will have to spend less time plotting and more time exploring the results. The user can enter principal stresses or the complete stress tensor and the program will calculate and plot the results. Likewise, the program can do simple calculations such as how much pore pressure will produce a fracture (i.e., hydraulic fracturing) or what are the range of orientation of planes that will be reactivated under a particular loading condition. The plots produced can be saved as high quality vector graphics in the .svg format.
MohrPlotter is intended for teaching use only and is not to be used in any application, commercial or otherwise where property or life are at stake. The user assumes all risks related to the use of this software. The author will not be held responsible for incorrect results or inappropriate use of the program, or damages arising therefrom.
Version History
v. 3.1.0 — 2024.10.07
NEW: Plot and calculate failure using the Hoek-Brown failure criterion.. MohrPlotter shows you the results of all of the calculated Hoek-Brown parameters and displays the “equivalent” Mohr-Coulomb parameters.
FIXED: A crashing bug related to incomplete entries in the preexisting failure envelope part of the interface.
v. 3.1.0 — 2024.01.30
NEW: Set a fixed value for the axes scaling. This is useful if you are trying to produce several plots all that the same scale. In the Inspector, select the “Circles and Axes” tab and check the “Fixed Axes” checkbox. The, enter the maximum value of normal stress that you want to display on the plot. Now, as long as you do not resize the window, all plots will be at the same scale.
IMPROVED: PDFs now include transparency.
FIXED: The plot now renders correctly even if your principal stresses are very small (say, less than 2 Mpa).
FIXED: Filling the circles with user selected colors now works as expected.
FIXED: A crash that occurred when deleting the last remaining plane while it was selected.
v. 3.0.8 — 2022.12.06
Further refinements to the graphics model.
v. 3.0.7 — 2022.11.24
NEW: Reactivation angles are now included in SVG plots (they were already included in PDF plots).
FIXED: Various additional issues related to pre-existing fractures with residual cohesion (thanks Juanmi).
v. 3.0.5 3.0.6 — 2022.11.13
FIXED: a crash that occurred while loading save analyses (thanks, Daniela)
FIXED: residual cohesion on preexisting fractures is now correctly accounted for in slip tendency and reactivation angle calculations.
v. 3.0.0 — 2019.10.17 (now save or copy as PDF!)
Save as PDF file: pdfs are scale to page size. As before the graphic saved is determined by whether the Mohr Circle or the Tensor Window is in front.
Copy as PDF: Click on the graphic that you want to copy to the clipboard (a focus ring will appear around the canvas) and just choose Edit>Copy. A high quality/resoution pdf object will be place on the clipboard for pating into any graphics, word processing, or presentation application that can accept pdf data on the clipboard.
Print: you can now print the graphic in the frontmost window by selecting File>Print
Plot full Griffith failure envelope instead of the Coulomb failure envelope. Just toggle the new checkbox in the Envelopes & Points tab of the Inspector Palette.
Set the font size for the numbers and title labels on the axes of the Mohr Circle plot in the Inspector Palette.
Mac OS version is now delivered as a Apple package installer. It has been hardened and notarized by Apple as required by the new Catalina operating system.
The Users Manual is now part of the Resource folder of the application so should always be available to the user
v. 2.9.0 — 2019.02.27
Now available in 64-bit version for all platforms (the Mac version is 64-bit only because all Mac OS X systems are 64-bit)
High density display (AKA “Retina”) and Mojave dark mode aware
Setup installer for the Windows versions puts all the pieces in the right place
Slight updates to the manual
Updated copyright date
v. 2.8.3 — 2015.12.16
Fixed a bug where a plane orientation was lost when first opening the Tensor Window.
Changed field tab order in the Mohr circle window
Default setting for entry of static friction value is now the coefficient of static friction rather than the angle of static friction
v. 2.8.2 — 2015.11.23
Moved slip tendency command to the Plot Menu where it is much easier to find. It is also still in the Inspector for those of you who are used to finding it there but it will, eventually, be removed from the Inspector.
If you hold down the Shift Key, the up/down arrows on the pore fluid pressure text box in the Mohr Circle Window will increment by 0.1; without the shift key the increment is 0.5.
v. 2.8.1 — 2015.09.29
Fixed a bug when trying to enter cohesion on a Windows system (thanks, Evan!)
Eliminated annoying flashing in the Stereonet view on Windows systems.
If you have entered a 2D stress field in the Mohr Circle view (i.e., no value specified for σ2) and then choose Tensor view, the program will arbitrarily assign a value for σ2 half way between σ1 and σ3
v. 2.8.0 — 2015.07.01
A new Plot>Stereonet> submenu allows you to control what is plotted in the stereonet plot of the Tensor Window. These options are only available when the Tensor Window is active and in front.
Some menu choices have been renamed more informatively
Users manual has been updated
Corrected a bug where a newly read in data file would forget the traction and shear vector orientations.
v. 2.7.5 — 2015.06.03
Added a calculation where if you know the normal and shear stresses on two planes that are parallel to σ2, the magnitudes of the σ1 and σ3 can be determined.
Added a "Tensor Window" command to the Window menu
v. 2.7.1 — 2015.03.05
The Tensor Window can now be resized allowing you to display, and save as .svg, larger stereonet views.
plotting of construction lines is automatically turned off if you read in a data set with more than two planes. You can always turn them back on again in the Plot menu if you want.
Program now behaves better if you just change the magnitude but not the orientation of principal stress and then press recalculate.
v. 2.7.0 — 2015.03.01
The stereonet view in the Tensor window can now be saved as a high quality vector graphic in the .svg format. To save the view, make sure that the Tensor Window is the frontmost window, then choose File>Save SVG. If the Mohr Circle window is in front, then File>Save SVG will save the Mohr Circle graphic.
Improvements and fixes to the calculation and display of slip tendency (which you turn on via the Inspector palette).
v. 2.6.1 — 2015.02.21
Shear stress on a plane is now plotted in the stereonet view
Bug fixes
v. 2.6.0 — 2015.01.21
You can color the planes, in both the Mohr diagram and stereonet views, by slip tendency (Morris et al., Geology, v. 24, p. 275-278) by checking the new slip tendency checkbox in the Inspector palette. Blues and greens have low slip and oranges and red high slip probability. This colors the actual measured planes not the total region of low slip probability.
Clicking on a dot that represents the normal and shear stress on a plane in the Mohr plot window selects the plane in the Tensor window.
You can now select multiple planes at once, either in the planes orientations listbox (hold down the shift or command key for contiguous or non-contiguous selection), or in the Mohr plot view (hold down the shift key).
more bug fixes and some debugging code removed.
v. 2.5.1 — 2015.01.19
Added a Window>Planes Detail menu option that is enabled when the tensor window is in front. This will provide additional information on the stress on the selected plane. You can copy and paste from this window.
The stress coordinate system is now fixed so that it is always a right-handed coordinate system. If you see a stress axis in the stereonet view which is plotted with a hollow symbol, that means that you are seeing the negative direction plotted in the lower hemisphere (i.e., the positive direction of the stress axis is in the upper hemisphere).
Additional minor stability improvements.
v. 2.5.0 — 2015.01.16
You can now enter an unlimited number of planes in either geographic or stress coordinates; you are no longer limited to just three planes
Import planes from a text file. The text file has the format of a Stereonet v. 6 file (which Stereonet v. 9 can read and write as well. The file must have a one line header of your choosing (it is ignored on input), followed by one plane datum per line, right-hand rule with strike and dip values separated by a tab.
Save a complete model to disk as a text file so you can read it back in at any time without having to retype any values. You can also use this text file to extract values from the analysis for further study such as...
Not only the magnitude but also the orientations of traction, normal, and shear stress on each plane is saved to the disk file.
Option to use either the tensor or the traditional Mohr Circle convention for shear stress sign (which are opposite to each other) simply by ticking a checkbox in the Inspector
When you change the stress configuration, you can specify via the Inspector whether you preserve geographic coordinates of the planes when you transform the stress (which will change the magnitude and orientation of stress on each plane) or whether the planes transform with the stress so that the angles that the planes make with the principal axes remain the same but the geographic orientations of the planes change.
The stereonet view now displays the orientation as you move the cursor inside the net. Clicking and dragging the mouse inside the net allows you to measure angles (which is great for teaching to understand the relationship between angles is stress space and in geographic space).
All planes are listed in the Plot menu and can be turned on and off individually
Lots of bugs fixed regarding sign of the shear stress and in general plotting in the lower half of the circle (i.e., where shear stress in negative).
Probably a whole new slew of bugs introduced!
v. 2.0.0 — 2014.12.05
Draws the concentric circle arcs for normal and shear stresses on planes not parallel to principal axes
Lines defining reactivation angles can be plotted from new menu choice in the Plot Menu (thanks to Paul K. for the suggestion)
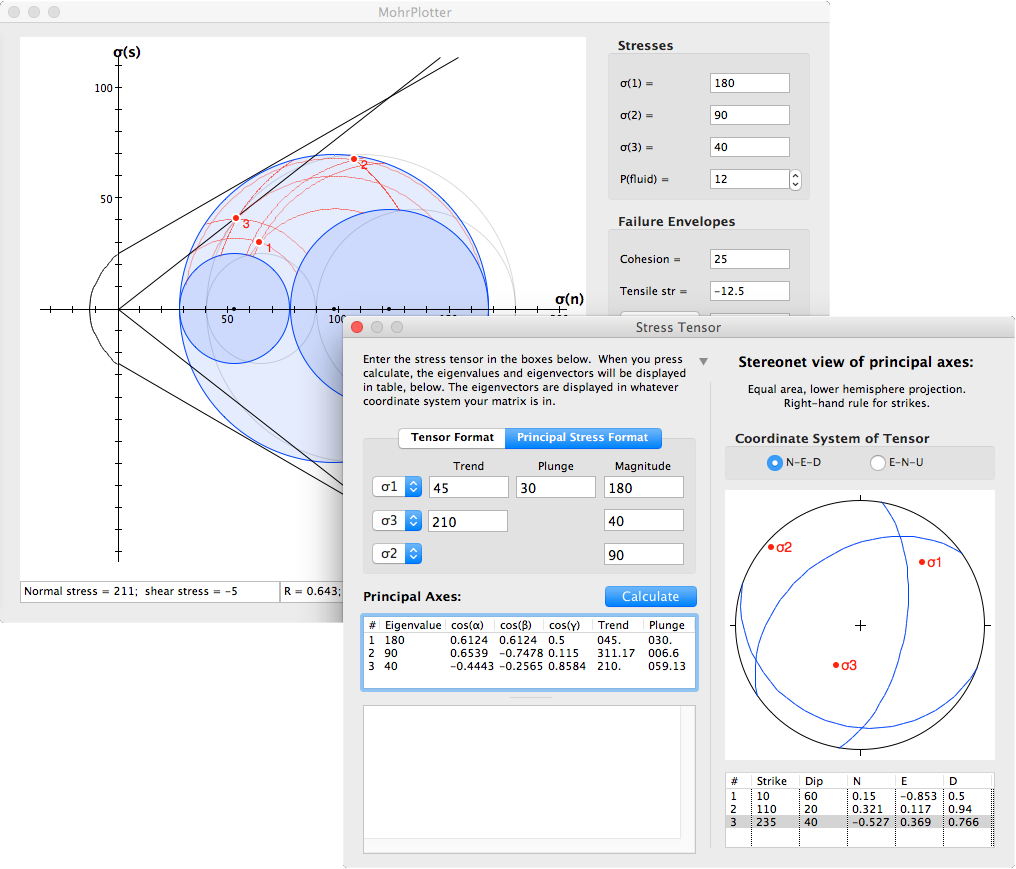
Stereonet view in the Enter as Tensor Window! Once you calculate the principal axes of the tensor the physical locations of the axes of the tensor will be shown in the Stereonet view. You can specify whether the tensor is defined for an North-East-Down (NED) structural or an East-North-Up (ENU) gesgraphic coordinate system. The stereonet view is displayed by toggling the small disclosure triangle in the upper right corner of the Enter as Tensor Window.
Enter as Tensor window now allows you to enter principal stresses with orientations in trend and plunge and the program will compute the appropriate tensor in either NED or ENU coordinate systems
You can enter up to three planes in geographic coordinates and see them plotted in both the stereonet view and in the Mohrs Circle
The points representing normal and shear stress on the three planes are now numbered according to their number in the Poles to Planes pane and you can choose to highlight the point whose plane is selected via the popup menu in Poles to Planes pane.
Updated users manual
Fixed a problem labeling axes when large stresses (e.g., 1000) were entered
Fixes a problem where you couldn't change the thickness of the axes.